
Challenges Arise Amidst Traditional Pharma Company Managements
The South Korean healthcare landscape has witnessed significant transformations over the past 25 years, with notable shifts in pharmaceutical policies and regulations. In light of these changes, 'Until the End, Hit' has conducted a comprehensive examination of the performance trends within the pharmaceutical sector.
① A closer look at the 25-Year Performance of 62 Listed Pharma Companies
In Issue 9 of 'Until the End, Hit', the dynamic evolution of South Korea's pharmaceutical industry is analyzed. Despite a surge in sales and outward growth, listed pharmaceutical companies have grappled with declining profitability, indicating underlying challenges within the sector. Noteworthy advancements in research and development, such as Yuhan's 'Leclaza' and CJ HealthCare's global technology contracts, underscore ongoing innovation efforts.
The analysis delves into the macroscopic trends shaping the industry's trajectory over the past quarter-century, with an eye towards fostering sustainable growth over the next decade and beyond.
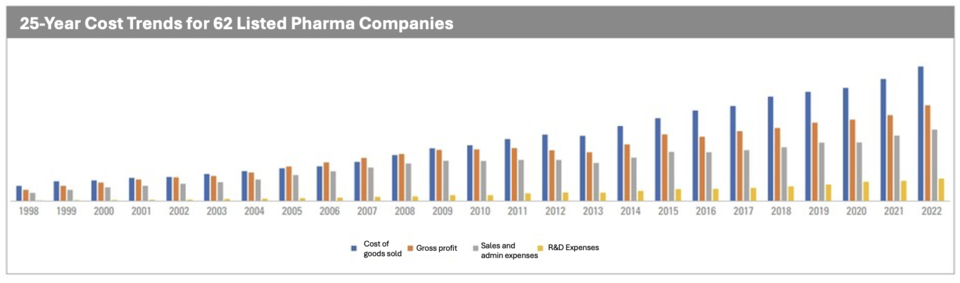
Explosive External Growth Despite Weak Internal Foundation
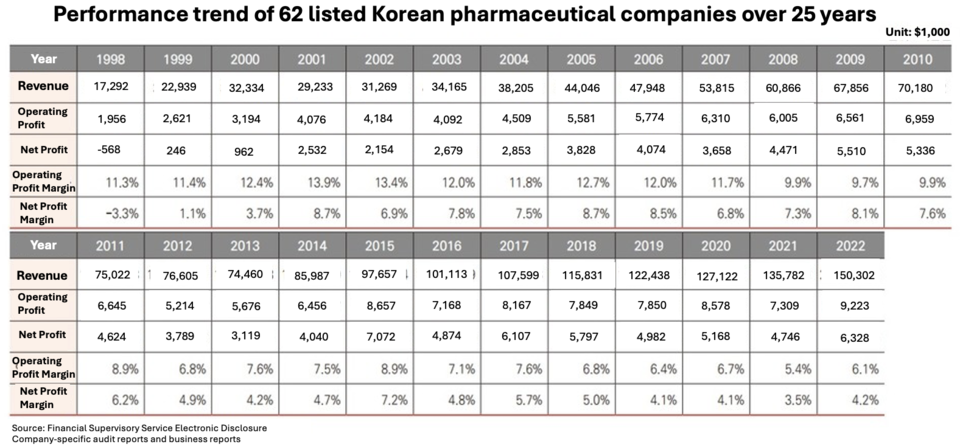
An examination conducted by "Until the End, HIT" scrutinized the performance of 62 publicly listed pharmaceutical entities spanning from 1998 to 2022. Within this timeframe, revenues surged dramatically, ascending nearly tenfold from approximately $1.7 billion in 1998 to approximately $15 billion by 2022. Notably, in 2022, four pharmaceutical companies boasted annual sales surpassing $740 million each: Yuhan Corporation, ChongKunDang, GC Biopharma, and Daewoong Pharma. Hanmi Pharmaceutical narrowly missed this threshold with sales reaching $727 million. In the initial assessment of top pharmaceutical companies' sales rankings in 1998, ChongKunDang and Yuhan Corporation led the pack, with only Il-Yang Pharma, ChongKunDang, and Yuhan Corporation exceeding $148 million in annual sales.
Research indicates a steady expansion of the pharmaceutical market in South Korea post-2000. Data from the Korea Pharmaceutical and Bio-Pharma Manufacturers Association (KPBMA) underscores this growth, with market size ballooning from $13.5 billion in 2009 to $21.4 billion in 2022. While it's prudent to acknowledge that the analysis by "Until the End, HIT" focuses solely on the performance of listed pharmaceutical entities, potentially diverging from the broader market, the overarching growth trajectory remains consistent.
Operating profit experienced a notable upswing from approximately $192 million in 1998 to a range of $888 million in 2022, representing nearly a quintuple increase. This progression, though seemingly modest relative to revenue, underscores the steadfast profitability stemming from astute managerial endeavors within the pharmaceutical sector.
A pivotal milestone was reached in 2015 when the collective operating profit of the 62 listed pharmaceutical companies surpassed $740 million for the first time. Hanmi Pharma garnered acclaim during this period for its pivotal role in elevating the South Korean pharmaceutical landscape through several substantial global technology export agreements. However, the subsequent year witnessed a setback as Hanmi Pharma encountered reversals in its technology exports, precipitating a decline in operating profit below the $740 million threshold. Despite this setback, Hanmi Pharma rebounded, subsequently achieving triumphs in global technology exports, thereby fostering a continued upward trajectory in operating profits for Korean pharmaceutical entities.
Net profit similarly witnessed a significant surge, propelled by heightened sales and augmented operating profits. Starting at $23.6 million in 1999, net profit surged to a range of $629 million by 2022, albeit falling short of the $740 million benchmark. Collectively, these trends over the past 25 years denote a steadfast outward growth trajectory for the Korean pharmaceutical industry, heralding a promising future.
However, a closer scrutiny raises pertinent questions regarding internal stability amid external expansion. The operating profit margin of the 62 listed pharmaceutical companies, which stood at 11.3% in 1998, precipitously dwindled to 6.1% by 2022. This decline in profitability is ascribed to the government's reinforced rebate regulations, contracting operational landscapes, and substantial drug price reductions. Notably, the operating profit margin plummeted from 8.9% in 2011 to 6.8% in 2012, coinciding with the enactment of uniform drug price reduction policies, marking a period of significant profitability downturn for pharmaceutical entities.
A pharmaceutical industry spokesperson elucidated, "The government's stringent regulatory measures, including the implementation of the dual-track rebate system and uniform drug price reductions, aim to bolster the financial stability of the national health insurance system and propel the pharmaceutical sector forward." They further underscored, "Unlike other industries, the government directly dictates drug prices, consequently exerting direct influence on the sales and profitability of individual pharmaceutical entities."
Revenue Climbs Amidst Rising Expenses; R&D Investment Soars
Despite increased sales and operating profit, declining operating profit margins signal a gradual decline in profitability, attributed mainly to escalating operating expenses. Operating expenses have surged from $540 million in 1998 to over $4.6 billion in 2022, surpassing $4.1 billion. This rise has offset the sales increase, leading to reduced operating profit margins.
However, amidst this profitability challenge, there's a positive trend in research and development (R&D) investment. Starting from surpassing $74 million in 2001, R&D spending has surged exponentially, hitting milestones of $148 million in 2004, $222 million in 2006, $296 million in 2008, $370 million in 2009, and exceeding $444 million in 2011.
In 2015, R&D investment exceeded $740 million for the first time, indicating strong motivation for aggressive R&D investment, particularly with Hanmi Pharmaceutical's significant global technology exports. Notably, in the same year, the proportion of R&D expenditure to revenue surpassed 8% for the first time, highlighting a commitment to aggressive R&D investment among the top pharmaceutical companies.
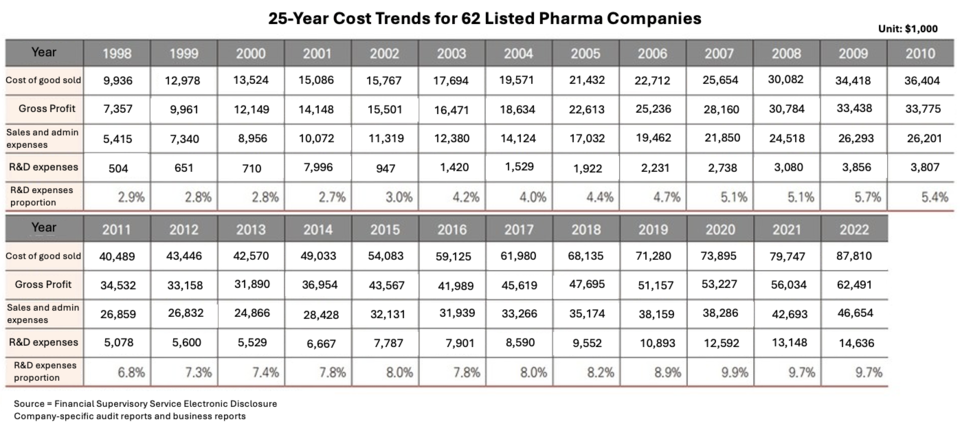
In 2022, R&D investment among listed pharmaceutical companies reached nearly $1.5 billion, with the proportion to revenue standing at 9.7%, approaching the 10% mark. Data from the KPBMA’s Pharmaceutical and Bio-Industry Data Book released in December 2023 revealed that the average R&D expenditure compared to revenue for listed pharmaceutical companies in 2022 was 12.7%.
A bio-specialized accountant emphasized the significance of the absolute increase in R&D figures, citing global clinical trials and talent recruitment as driving factors for escalating R&D costs. They stressed the importance of not only the quantity but also the quality of R&D investment, including promising targets and new treatment modalities.
A senior executive in the pharmaceutical industry highlighted the direct impact of sustained R&D efforts and investments on a company's performance, underscoring the sector's consistent increase in R&D investment as a guarantee of future growth potential, despite the substantial costs, time, and inherent risks associated with drug development.
CMG Pharm, HK inno.N, HLB Pharm, JW Life Science, JW Shinyak, JW Pharm, Kyung Nam Pharm, Kyung Dong Pharm, Nice Pharm, Kwang Dong Pharm, Kukje Pharm, GC Biopharm, Daewoong Pharm, Daewon Pharm, Daehan New Pharm, Daehan Pharm, Daehwa Pharm, DongKoo Bio & Pharm, DongKook Pharm, Dong Sung Bio Pharm, Dong-A ST, Dongwha Pharm, Myungmoom Pharm, Boryung, Bukwang Pharm, BC World Pharm, Samsung Pharm, Sam-A Pharm, Samil Pharm, Samjin Pharm, Samchundang Pharm, Seoul Pharma, Celltrion Pharm, Sinsin Pharm, Shinil Pharma, Shinpoong Pharm, Ahn-Gook Pharma, Arlico Pharm, Yungjin Pharm, Optus Pharm, Withus Pharm, Korea United Pharm, YuYu Pharma, Yuhan, Reyon Pharm, Il Dong Pharm, Ilsung Pharm, Ilyang Pharm, Jeil Pharm, ChoA Pharm, Chong Kun Dang, Jin Yang Pharm, PharmaResearch Products, PharmGen Science, Hana Pharm, Union Korea Pharm, Korea Pharma, Handok, Hanmi Pharma, Hyundai Pharm, Whan In Pharm, Huons
Reference
For this survey, <Until the End, HIT> referred to the company's business reports or audit reports from 1998 to 2022, available on the Financial Supervisory Service Electronic Disclosure System. The earliest year available on the system is 1998, and it should be noted that some companies did not have business reports for 2023 (as of March 20, the date of article composition), so the performance was aggregated only up to 2022.
To maintain chronological consistency, the numbers for each company in each respective year were directly taken from the reports, considering potential discrepancies due to issues related to corporate restructuring for holding company conversion. Additionally, it is acknowledged that there may be some errors in the overall total due to items not disclosed for each respective year in the reports, indicated as blanks. The figures for each item were compiled based on the respective fiscal year and were all aggregated based on separate (individual) financial statements.